Dear Friends,
It seems to me that the back story about the German 6th Army’s destruction at the battle of Stalingrad is an apt metaphor for how global warming is being inflated.
After thee Russian Guards Armor had encircled 6th Army under Field Marshal Von Paulos, OKH and OKW were keen to free them. 6th Army was the spearhead of the German Army and contained the most battle hardened units. A communiqué went out to Von Paulos asking how much reserve supplies were at hand for a breakout.
Paulos then sent a communiqué to his commanders who then sent them out to their subordinates. The subordinates knowing that whatever they reported, more would be asked of them than their reported supplies would allow, so they withheld some from the tally… as a buffer. The commanders then added the reported amounts, then subtracted some, to make up for the fact that more would be asked than the supplies would allow. Then Paulos did the same thing. By the time the supply report got back to OKW and OKH the amount of supplies reported was a fraction of what was available. Making the picture more grim than it in fact was. The total amount was under reported at every step of the way to the point that, a breakout was not ordered, and 6th Army perished as a result.
Global warming is similar in that all it takes is for the ground units to inflate or deflate their reports a little. In the aggregate the slight over reports add up to a great over report of temperature rise. Each person thinks he or she is helping by showing the crisis is urgent and so is buffering the data a little. Just as the subordinate officers of the German 6th Army under reported their supply situation to “help” by being able to do the impossible if asked, some modern weather data collectors might inflate their numbers a little. Inflating the foundational information and skewing the reported rise in global temperatures dramatically.
For example the National Weather Service reports the Heating Degree Days. The heating degree day is a scalar of how much the daily average temperature was above or below 65 degrees Fahrenheit.
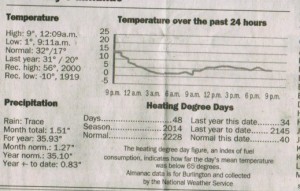
To illustrate, I have taken some days from December 2009 that were reported in the Burlington Free Press, the paper of record for the State of Vermont;

On December 18, 2009 the National weather service reported 48 heating degree days for December 17th 2009. The High was 9 degrees and the low was 1 degree. 9+1=10 10/2=5 The average temperature for December 17th 2009 was 5 degrees Fahrenheit in Burlington Vermont. Subtract 5 from 65 to get the heating degree days and you have 60. But the National Weather service reported only 48 heating degree days for that day. Under reporting the actual figure by 12 degrees. Last year that day the Weather Service reports that the high was 31 and the low was 30. So 31+30=61 61/2=30.5 round up and you have 31. The average temperature for December 17 2008 was 31 degrees. Subtract 31 from 65 and you have 34 heating degree days for December 17 2008. The Weather Service reports exactly 34. The averages for December 17 are 32 for a high and 17 for a low. 32+17=49 49/2=24.5 round up to 25. Subtract 25 from 65 and you have 40 heating degree days for December 17th on average and that is what the National Weather Service reports is normal.
The question I have is why is December 17 2009 so underreported for heating degree days? The heating degree days as I have show were actually 60 when the National Weather service reported only 48. That would have made the average temperature on that day 17 degrees. Double the highest temperature seen on that day. This skews the seasonal heating degree days by showing less than there really was.
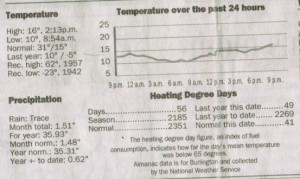
I have included another day to compare. December 21 2009. They under reported the heating degree days for the year prior;

What do you think about that? I have found that at least once a week the heating degree days are under reported or, in the summer, the cooling degree days are over reported The heating degree day figure is a foundational figure used in computing global climate change. As the heating degree days are under reported and the cooling degree days are over reported it skews the IPCC’s reported global temperature increases. In the aggregate, all the little over and under reporting adds up to a lot, due to errors in the “original” data. At least the data that hasn’t been destroyed.
Check it out yourself in your local news papers. The math isn’t hard. Maybe it’s time we started looking into things for ourselves… and stop trusting people who have shown themselves over and over to be untrustworthy. Under tyrannies, the people have no means, in the democratized countries we have the means. Until we give it up to the global warming panic mongers.
Lets hope and work so that the little buffers, don’t have the same result on us… as it did 6th Army.

